AI agent observability: why your monitoring dashboard can't debug your agents
AI Agents · By Caleb Sakala · March 29, 2026
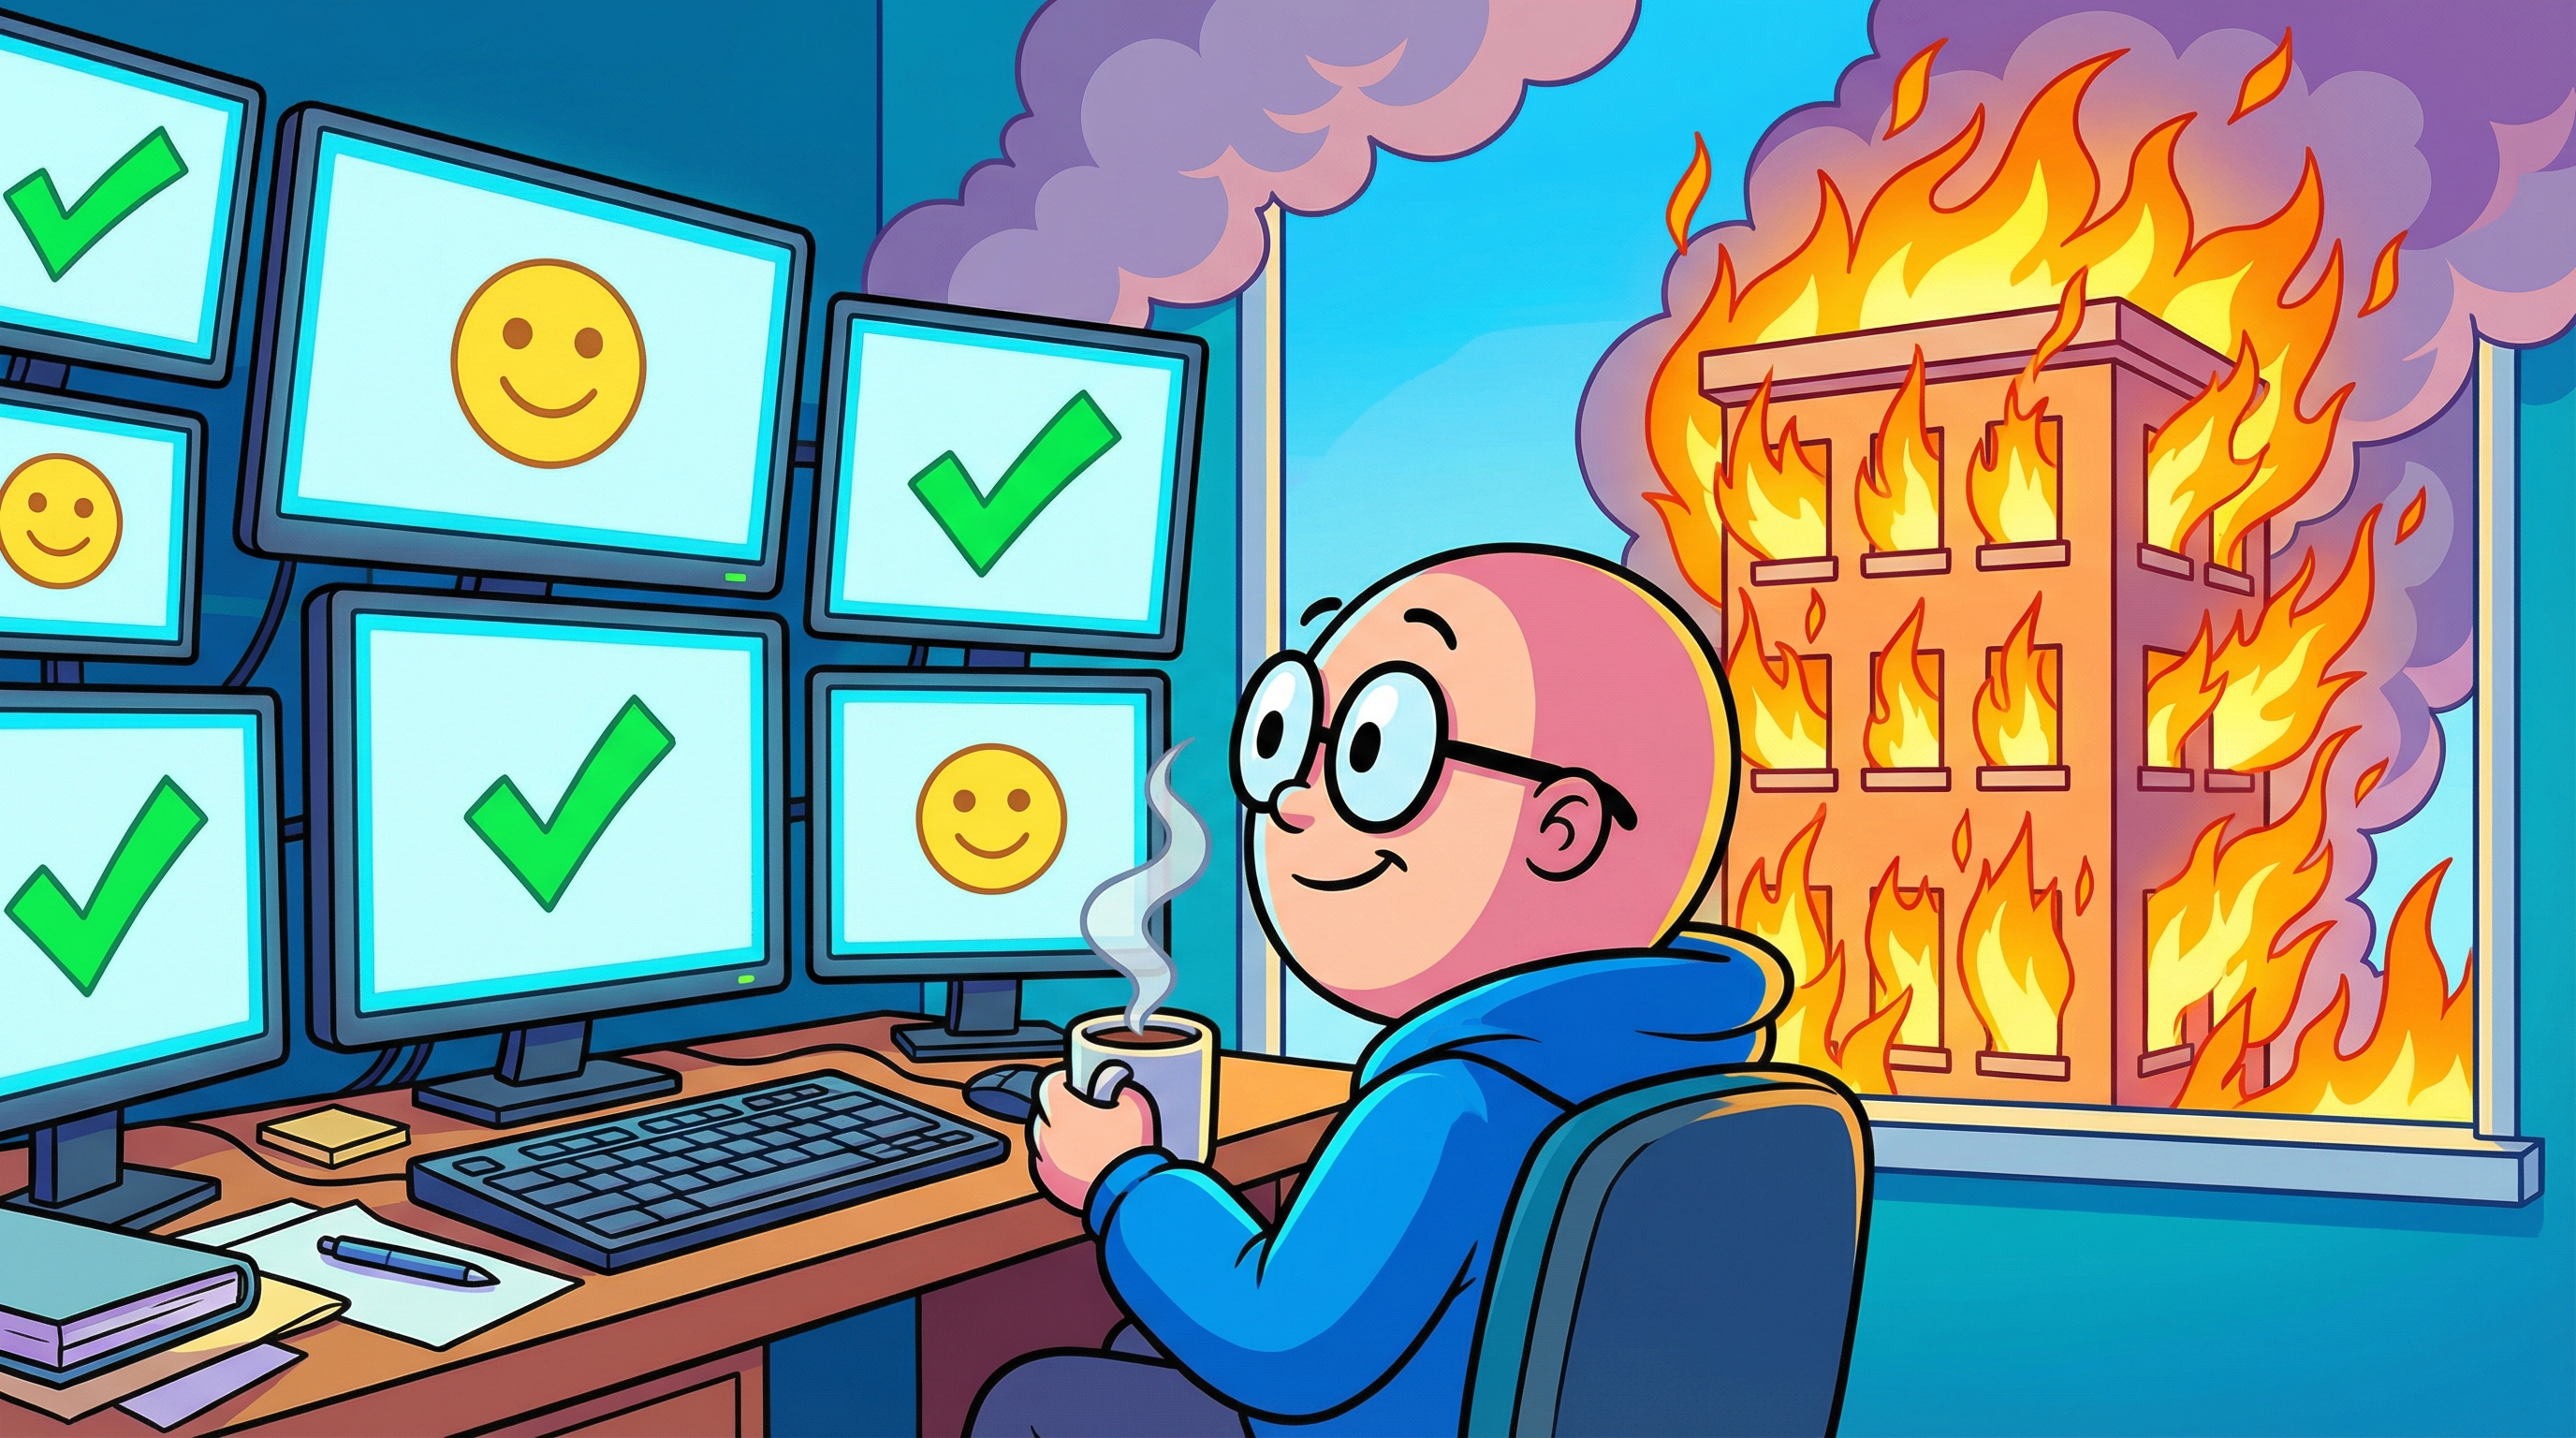
Notion's engineering team spent two weeks tracking down a bug in their AI assistant that traditional monitoring never flagged. The agent was returning plausible, well-formatted answers to user questions about workspace permissions. Every health check passed. Latency stayed under 400ms. Error rates held steady at 0.2%. The problem: roughly 15% of those confident-sounding answers were wrong. The agent was hallucinating permission settings that didn't exist, and no dashboard caught it because the HTTP response code was 200 every single time.
This is the central failure of applying traditional application monitoring to AI agents. APM tools were built for a world where software either works or throws an error. AI agents break in a third way: they succeed incorrectly.
AI agent observability is not infrastructure monitoring
AI agent observability is a different discipline than infrastructure monitoring, and the tooling gap is only now starting to close. Traditional observability stacks track three things well: latency, error rates, and throughput. For a REST API or a web server, those metrics tell a nearly complete story. A spike in 500 errors means something broke. A latency increase means something slowed down. The dashboard makes the problem visible.
AI agents generate none of those signals when they fail. A workflow that routes customer support tickets to the wrong department, summarizes a contract with a missing exclusion clause, or recommends a product that's been discontinued will produce clean telemetry across the board. The request completed. The tokens were consumed. The response was delivered. And the output was wrong.
PwC's 2026 AI Agent Survey found that 79% of organizations have deployed AI agents in some capacity. Most of those organizations cannot trace a failure through a multi-step workflow or measure output quality in any systematic way. The agents are live. The monitoring is not.
What actually breaks in multi-step AI workflows
Single-call LLM interactions are relatively simple to debug. Send a prompt, get a response, check the response. The interesting failures happen in multi-step workflows where agents chain tool calls, conditional logic, and multiple model invocations.
Consider a procurement automation that receives a purchase request, looks up vendor pricing from an API, compares three quotes, applies company policy rules, and generates an approval recommendation. That workflow might involve six to ten discrete steps, each with its own inputs, model call, and outputs. When the final recommendation is wrong, which step caused it?
Traditional logging captures each step in isolation. What it misses is the context flow between steps. Step three used the output of step two as input, but step two truncated a vendor name because the context window was close to capacity. Step four applied a policy rule correctly, but to the wrong vendor because step three's comparison was based on truncated data. The final output looks like a policy error. The root cause was a context management issue three steps earlier.
This is where AI agent observability platforms differ from general-purpose monitoring. Tools like Braintrust, Langfuse, and Arize capture traces: the complete decision path across every step, including the full prompt, the model's response, the tool calls made, and the intermediate outputs passed forward. Think of it as a call stack for non-deterministic systems.
OpenTelemetry is becoming the common language
One development that deserves more attention than it's getting: OpenTelemetry is rapidly becoming the standard instrumentation layer for AI agent telemetry.
This matters for a practical reason. Until recently, every observability platform required its own SDK, its own data format, and its own integration hooks. Switching from one tool to another meant ripping out instrumentation code and replacing it. For teams already dealing with the complexity of multi-step AI workflows, adding vendor lock-in to the observability layer was an unnecessary tax.
OpenTelemetry's GenAI Semantic Conventions now define a standard schema for prompts, model responses, token usage, tool calls, and agent metadata. Frameworks like Pydantic AI, smolagents, and Strands Agents emit traces using this schema natively. Datadog announced native support for the conventions in early 2026. Elastic's observability team published a roadmap built entirely around them.
The practical result: teams can instrument once and send telemetry to any compatible backend. Langfuse (23,000 GitHub stars and recently acquired by ClickHouse) supports the standard. So do Arize, Braintrust, and most of the newer entrants. For anyone building production AI workflows today, instrumenting with OpenTelemetry rather than a vendor-specific SDK is the safer architectural bet.
Five AI agent observability failures your dashboard misses
Not every AI agent failure looks the same. Competing articles tend to list generic categories ("hallucination," "latency," "cost"). Here's what actually shows up in production traces when you have proper observability in place, based on patterns reported across Braintrust, Maxim, and Langfuse deployments.
Silent quality degradation. The agent's outputs get slightly worse over time as the underlying model receives updates or as the data it retrieves drifts. No single run fails. Aggregate quality scores drop 8-12% over a month. Without automated evaluation running on every trace, this is invisible.
Tool call loops. The agent attempts a tool call, gets an ambiguous response, retries with slightly different parameters, gets another ambiguous response, and repeats. Five tool calls that should have been one. Latency doubles, token costs triple, and the final answer may incorporate conflicting information from the redundant calls. Standard metrics show a slow request. Trace-level observability shows the exact retry loop.
Context window pressure. The conversation history or retrieved documents push the context close to the model's limit. The model silently drops or compresses earlier context. In a customer service workflow, this means the agent "forgets" what the customer said three messages ago. HTTP status: 200. Customer satisfaction: plummeting.
Cross-step data corruption. One step's output becomes the next step's input, but the format is slightly off. A JSON field that should be a number arrives as a string. The downstream step doesn't crash (LLMs are remarkably tolerant of messy inputs) but produces subtly wrong results. This pattern is especially common in workflows with more than five steps.
Model routing mismatches. Teams using model routing (sending simple tasks to cheaper models like Claude Haiku 4.5 at $1/$5 per million tokens, complex tasks to Claude Opus 4.6 at $5/$25) sometimes discover the routing logic miscategorizes tasks. A contract analysis that needed a frontier model got sent to a budget tier. The output was fluent and structurally sound. It also missed two critical clauses.
Evaluation is the missing layer
The observability platforms that are gaining traction in 2026 share one feature that separates them from traditional monitoring: automated quality evaluation.
Braintrust built its entire product around this concept. Every trace can trigger an evaluation function that scores the output on whatever dimensions matter: factual accuracy, format compliance, policy adherence, tone. Notion adopted Braintrust specifically because the same evaluation metrics used in development run identically in production, eliminating the gap where demo-quality code degrades after deployment.
Langfuse takes a different approach, emphasizing prompt versioning alongside evaluation. When a quality score drops, teams can correlate the decline with a specific prompt change and roll back within minutes. For teams running a platform like Chase Agents, where each automation step can specify its own model and prompt configuration, this kind of per-step version tracking translates directly: if step three of a seven-step workflow starts producing lower-quality output after a prompt update, trace-level evaluation pinpoints the regression without requiring a full workflow replay.
The evaluation-first approach also changes how teams think about releases. Instead of "deploy and hope," they can set quality thresholds that gate deployment. If the new prompt version scores below 0.85 on accuracy across 500 production traces, it rolls back automatically. This is the AI equivalent of canary deployments, and most teams aren't doing it yet.
What to instrument first
For teams just starting with AI agent observability, instrumenting everything at once is a mistake. The volume of telemetry from a busy AI workflow is enormous (production agents can generate millions of traces daily), and most of it will be noise until you know what to look for.
Start with the outputs. Instrument the final response of every workflow with an automated evaluation. Even a simple LLM-as-judge check ("does this response answer the user's question? score 1-5") catches the most damaging failures: the ones your users see.
Then trace the tool calls. Most production failures originate in tool interactions, not in the LLM reasoning itself. API timeouts, malformed responses from external services, rate limits, authentication failures. These are conventional debugging problems dressed up in an AI workflow, and they're the easiest to fix once visible.
After that, add cost tracking per step. Without per-step cost attribution, teams optimize globally when they should be optimizing the one step that's burning tokens on unnecessarily long context. A seven-step workflow might show $0.40 per run in aggregate. Per-step tracing reveals that step four alone accounts for $0.31 because it's sending the entire conversation history to a frontier model when a summary would suffice. Chase Agents exposes this kind of per-step token usage and model selection in its workflow execution logs, turning a vague "costs are high" complaint into a specific, fixable configuration change.
Context flow analysis comes last. It's the most valuable but also the most complex to instrument. Capturing the full input and output of every step, including the context passed between steps, generates significant storage and processing overhead. Save it for the workflows that are already in production and generating revenue or handling critical decisions.
The question nobody's answering yet
Here's a challenge for any team running AI agents in production: can you reconstruct exactly what happened during any specific agent run from 48 hours ago? Not a summary. Not the final output. The full decision path: every prompt, every model response, every tool call, every intermediate result.
If the answer is no, the agents are running without a flight recorder. When (not if) something goes wrong in a way that matters, debugging will be guesswork. The 79% of organizations that PwC found deploying agents without proper observability are building on a foundation they can't inspect. Pick one production workflow this week. Instrument it. Run an evaluation on 100 traces. The results will either confirm that the system works as expected, or they'll show you exactly where it doesn't. Either way, you'll know something you don't know right now.